Reports
This guide will go over the basics of using the bottest.ai Reports Page (opens in a new tab), including configuration and understanding the content of the reports. You can always navigate to the Reports Page by clicking "Reports" in the menu on the left.

Viewing Reports
In the main Reports page, you'll see a table of Suite Runs for the selected Suite (across multiple Environments). You can use the dropdowns to change which Suite's data will be shown to you. Each Suite Run has a Timestamp, Suite Run ID (this is used for if you want to configure a specific Suite Run as the Comparison Suite Run), an Environment, who the Suite Run was initiated by, a link to the Interactive Report, and a way to easily download the report.

All Tests belong to a Suite, and all Suites belong to a Bot. If you're unsure how you should organize your Tests into Suites and Bots, check out the documentation on Bots, Suites, and Environments.
Configuring a Comparison
You can configure a Comparison Suite Run (this is what each Suite Run will be compared against in the Interactive Report) by clicking "Configure":

This will open up the following modal where you can select from the options:
-
Most Recent on Same Environment. This means that for each Suite Run's Interactive Report, it will select the most recently ran Suite Run on that same Environment. This option is especially useful if you are actively developing your chatbot and want your reports to show comparisons to the most recent version (that isn't itself).
-
Most Recent on Specific Environment. This means that for each Suite Run's Interactive Report, it will select the most recently ran Suite Run on a specific Environment. This option is especially useful if you have a Production Environment you want your Feature or Development Environment chatbots to be comparing against in reports.
-
Specific Suite Run. This means that for each Suite Run's Interactive Report, it will select a specific Suite Run. This option is esepcially useful if you want to compare all Suite Runs' performance against a specific benchmark Suite Run.

Interactive Report
You can click the "Interactive Report" button to open a new page and view the Interactive Report for the specified Suite Run. Additionally, you have the option to download the report directly if that is more convenient:

Upon opening the Interactive Report, you'll be brought to a page where you can see detailed information on the Suite Run with the following categories: Overview of Results, Improvements, Test Failure Details, and Performance. Each of the sections is outlined below with information on what is being measured as well as some things to look out for in your reports.
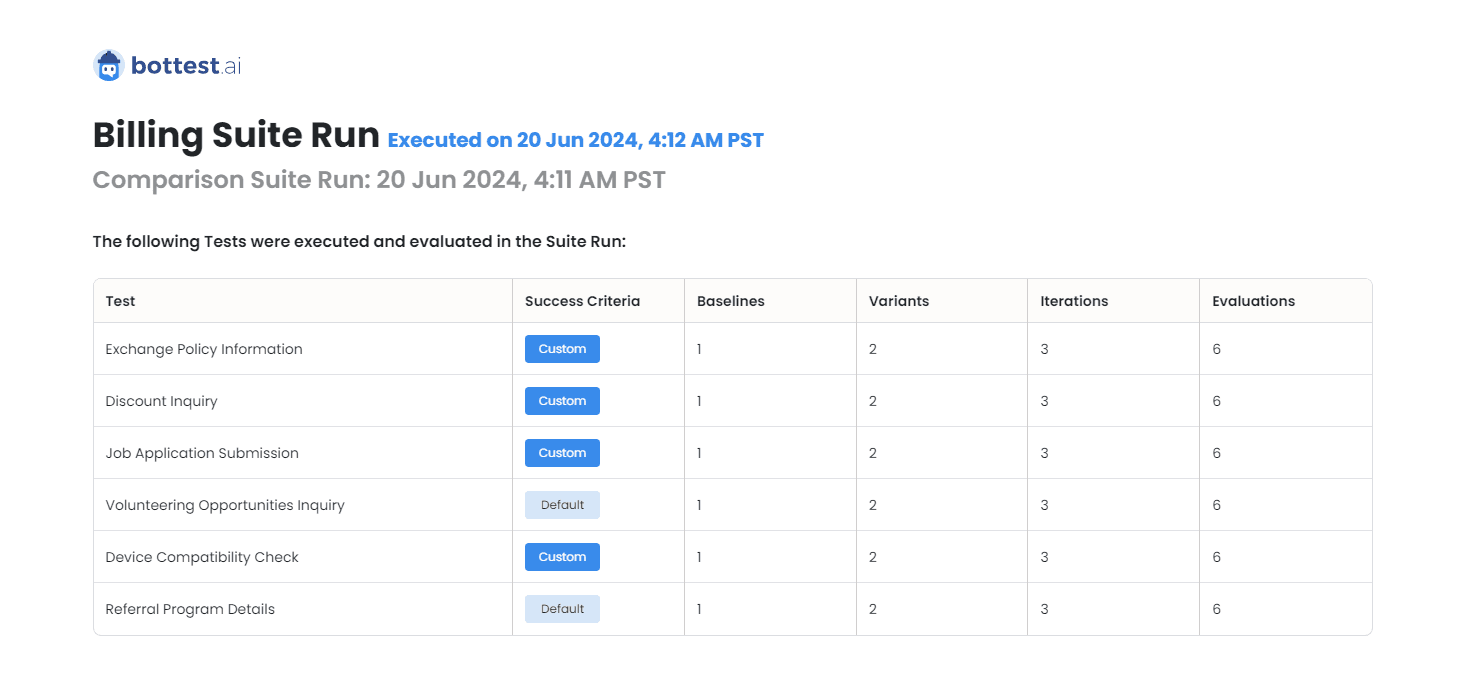
Additionally, you'll see at the start the list of Tests that were executed and evaluated as a part of the Suite Run. You can see the number of Baselines, Variants, Iterations, and total Evaluations, as well as whether the Success Criteria was custom or the Suite Default. You can click on the name of the Test and it will link to the Test customization page.
Overview of Results
This section provides overall information on the Test and Evaluation results from the completed Suite Run. You can easily view comparisons between the Suite Run and the Comparison Suite Run with the side-by-side charts.

Improvements
This section provides information on Tests that saw a higher pass rate in the Suite Run when compared to the Comparison Suite Run. You can click on the Test name and it will open the Test in a new page.
Test Failure Details
This section gives insight into Test failures, and displays a list of all of the Tests that either failed or had mixed results. You can see the Test pass rate (this is the percentage of evaluations that passed across all Variants/Iterations) while the Test was evaluated, and the failure summary as to why these evaluations failed. Note that this information is a summary of all of the individual failure reasons. You can see the individual failure reasons on an Evaluation level by clicking "See Test Run" and opening the Test Run results page.
Performance
This section provides information on the performance of the Suite Run compared to the Comparison Suite Run. The execution time (the time it takes to replay the conversation) is aggregated into the same categories as the Comparison Suite Run in order to easily compare values between the two.
Additionally, the report gives a table of Tests that had an average execution time that is >10% slower compared to the same Test's execution in the Comparison Suite Run. Next to the Test is the Average Run Time (from the Suite Run), the Comparison Average Run Time (from the Comparison Suite Run), the percentage slower it is, the Min Run Time (this is the quickest that the conversation was executed in the Suite Run), and the Max Run Time (the slowest that the conversation was executed in the Suite Run).
These averages, min, and max values are calculated from the individual recorded times for each conversation to fully replay. Generally, some variance and slight changes are expected in execution time across Suite Runs (due to both response length being varied and latency being varied). However, this data is useful to track large deviations in performance that should be investigated further.